Swine Production – Improvements with Lean and Six Sigma
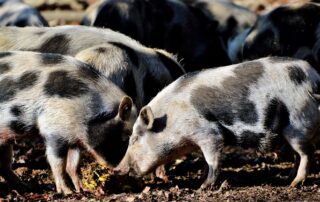
In 2024, China was the largest producer of pork globally, accounting for 48.4% of production with 55.9 million metric tons.* We’ll look at discussions of Lean and Six Sigma in swine production and finish with a video of a breeding farm. *Source Managing Swine Production Processes In a report titled “Managing complex processes in agricultural [...]


