
When constructing control charts with subgroups, there are two sources of variation: between subgroups and within subgroups. Standard Shewhart Xbar-R or S charts assume that the within subgroup variation is dominant. But that is not always the case. When that assumption is violated, what should be done?
In an earlier blog, we discussed control chart assumptions focusing on individual measurements. We discussed the three assumptions that must be met to use standard control charts:
- Normality
- Independence
- Single source of variation
In that blog we discussed checking for normality and independence and what to do if those assumptions are violated. We won’t repeat that here but refer the reader to that blog.
We also mentioned that whenever you have subgroups of size (n>1) you have two sources of variation: between subgroups and within subgroups. Standard Xbar-R or S Shewhart charts assume that the within variation dominates the between subgroup variation and compute control limits using within group variation. However, when that assumption is violated, the chart may signal out-of-control in error.
Our subject in today’s blog is how to address that violation and construct a valid set of charts.
We focus on the data below which have purposely been constructed so the between variation dominates. Three parts were measured 9 times at three times: 8, 10, and 12 for a total of 81 measurements.
Measurement unit time
99.94769 U1 8
101.4996 U1 8
99.3803 U1 8
98.6878 U1 8
99.54795 U1 8
99.04702 U1 8
97.51507 U1 8
99.17345 U1 8
99.824 U1 8
104.8878 U2 8
106.4198 U2 8
105.089 U2 8
105.6853 U2 8
104.6952 U2 8
104.4966 U2 8
106.3602 U2 8
107.4408 U2 8
105.324 U2 8
105.4675 U3 8
106.6495 U3 8
106.18 U3 8
106.2695 U3 8
104.5978 U3 8
108.3324 U3 8
106.0189 U3 8
106.6335 U3 8
103.8991 U3 8
108.7817 U1 10
110.882 U1 10
110.2276 U1 10
109.7745 U1 10
112.1022 U1 10
110.0986 U1 10
109.3953 U1 10
111.0387 U1 10
111.2031 U1 10
102.4965 U2 10
104.2954 U2 10
105.0348 U2 10
103.4638 U2 10
103.6232 U2 10
103.6188 U2 10
102.6365 U2 10
103.4634 U2 10
104.1675 U2 10
92.78638 U3 10
90.97761 U3 10
90.73421 U3 10
87.84462 U3 10
90.95633 U3 10
90.88918 U3 10
91.52432 U3 10
90.20963 U3 10
90.68796 U3 10
106.873 U1 12
107.6077 U1 12
106.0305 U1 12
106.8198 U1 12
108.7505 U1 12
105.1414 U1 12
106.1397 U1 12
107.0857 U1 12
105.2599 U1 12
90.66254 U2 12
90.72447 U2 12
91.01221 U2 12
91.36522 U2 12
92.43059 U2 12
89.47215 U2 12
90.43236 U2 12
94.01493 U2 12
89.67975 U2 12
108.8025 U3 12
111.2466 U3 12
110.65 U3 12
110.4378 U3 12
110.8013 U3 12
108.5154 U3 12
109.2172 U3 12
110.3213 U3 12
109.1064 U3 12
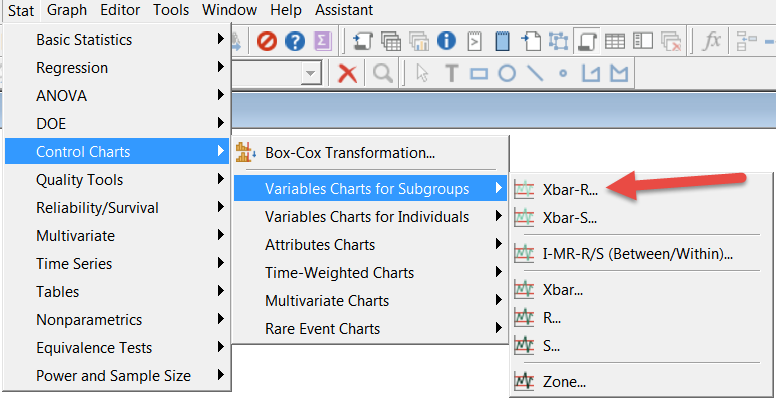
Ignoring the time to time variation, let’s construct an Xbar-R chart in Minitab 17.
Go to Stat>Control Charts> Variables Charts for Subgroups>Xbar-R.
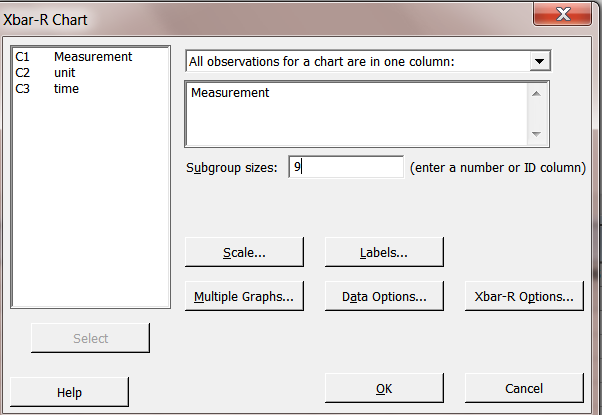
Select Measurement and enter Subgroup sizes of 9. Click OK.
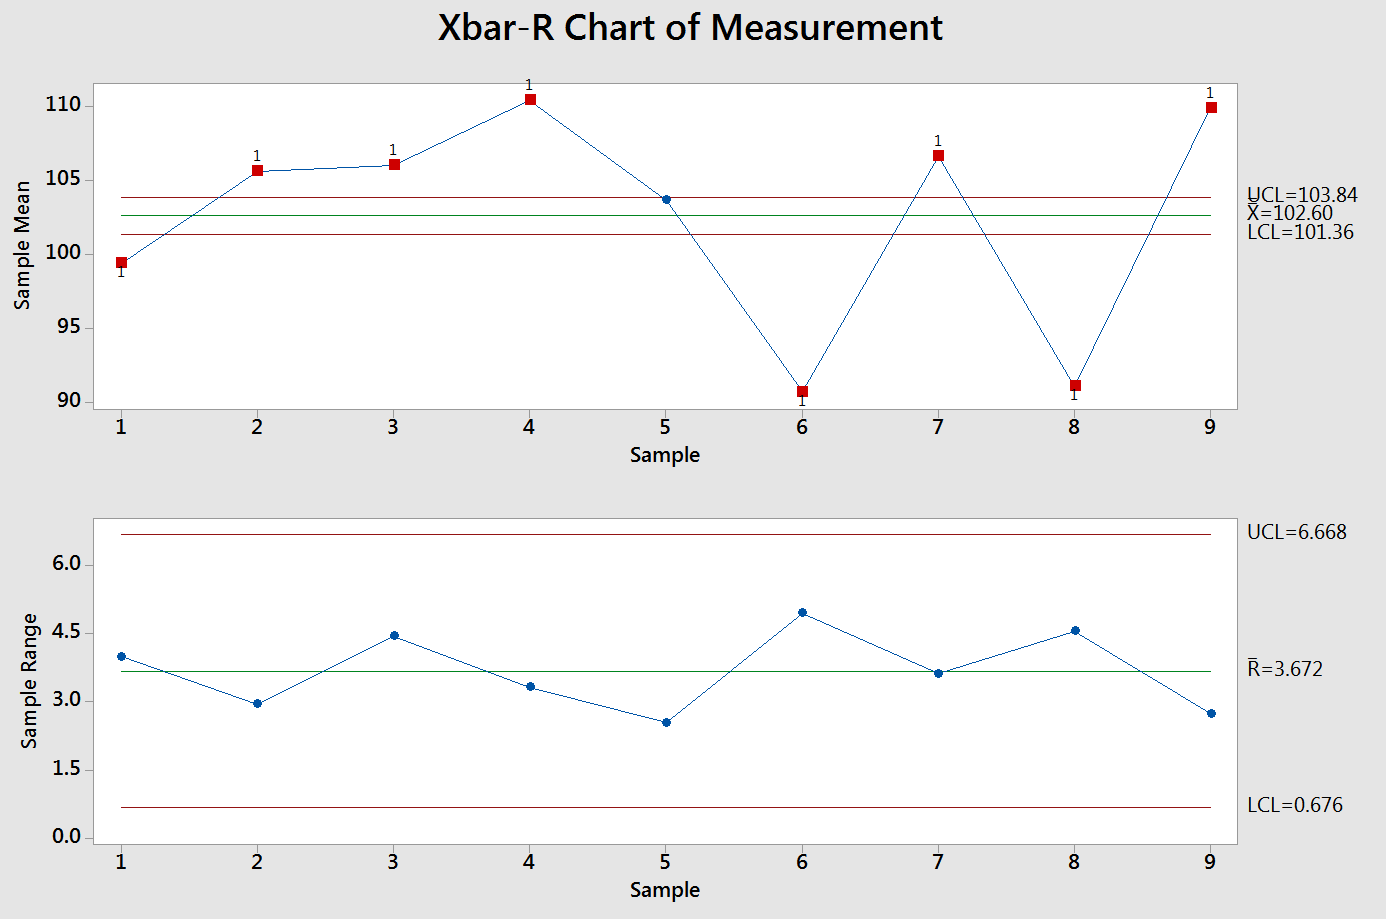
All points signal out of control but one. But remember in this data set, the between subgroup variation is large compares to the within subgroup variation. As the Xbar chart limits are based on within subgroup variation, we can see why the subgroup means, with larger variability, show out of control.
The I-MR-R/S chart is designed for this situation.
The chart consists of three control charts using both between subgroup and within subgroup variations.
- An Individuals Chart for monitoring the subgroup means. The control limits are calculated using the between subgroup variation .
- A Moving Range chart for the moving range of the subgroup means which monitors the between subgroup variation. This chart and the Individuals chart track both process location and process variation, using the between subgroup variation.
- An R Chart or S Chart which monitors the within subgroup variation. Note: if the subgroup size is 9 or greater, Minitab computes an S chart.
In combination, the three charts evaluate the stability of process location, the between subgroup component of variation, and the within subgroup component of variation.
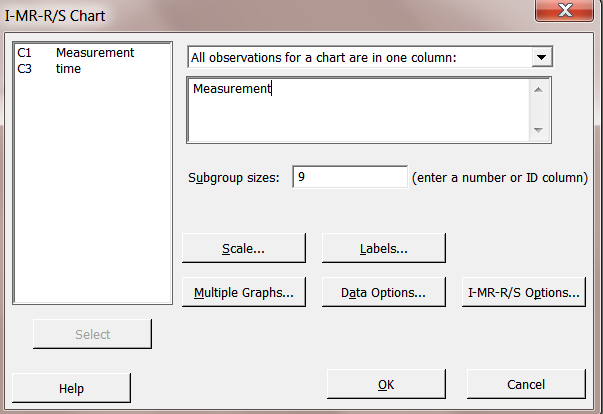
Let’s construct an I-MR-R/S chart for our data.
Go to Stat > Control Charts > Variables Charts for Subgroups > I-MR-R/S (Between/Within)
Enter the response and the subgroup size and click OK.
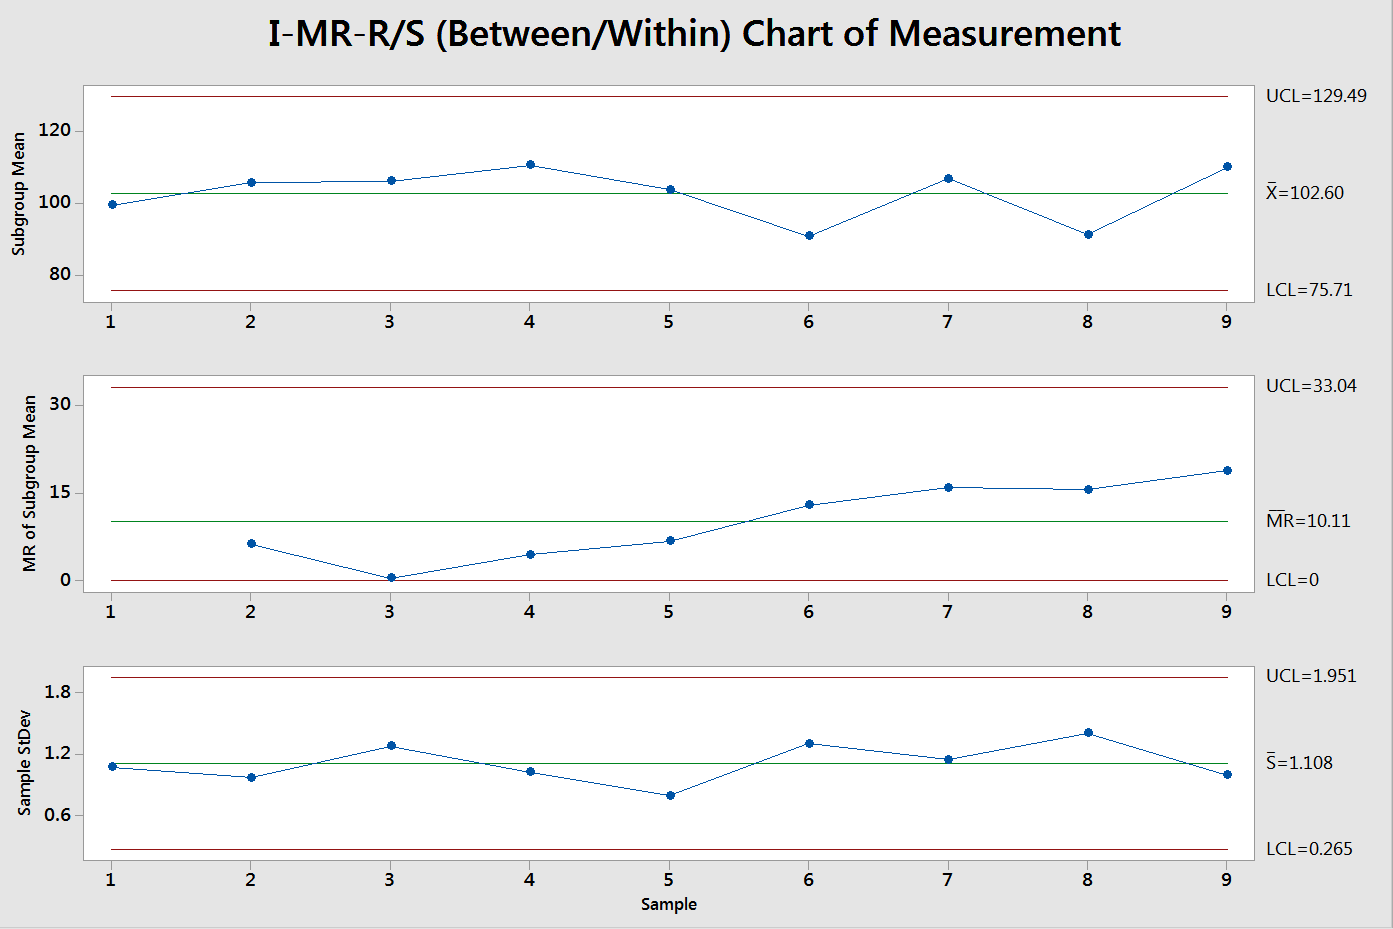
The I chart limits are now correctly computed based on the between subgroup variation. The process is in control.
From the Session window we see the estimates of the between and within subgroup variation.
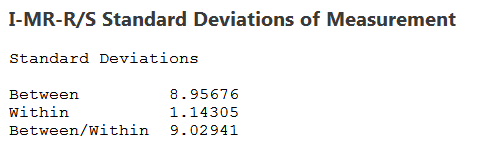
You can see that the between subgroup variation was much larger.


Leave A Comment