
Bootstrap Resampling takes an initial sample and randomly samples from that repeatedly with replacement. One then uses the data from the resamples to estimate various statistics. Bootstrap Resampling should be in your statistical toolkit.
We will explore the Bootstrap approach from various sources.
First, Mike Marin, Professor at the University of British Columbia clearly explains Bootstrap methodology in the context of estimating a mean.
Second, we look at how to implement Bootstrap for estimating a mean in Excel.
Third, we take the method mentioned in the above presentation on using Excel and take you through a realistic example of how to apply the Bootstrap using Excel and Minitab 17.
Fourth, we include an interview with renowned Stanford statistician Bradley Efron, the inventor of The Bootstrap.
Finally, we list some other videos from Professor Mike Marin using Bootstrapping for Hypothesis Testing and determining a Confidence Interval
First, Professor Marin.
In the Bootstrap approach, one takes a sample of size n. Then using that sample, we take a sample with replacement and compute the mean. Call this Bootstrap sample 1. Repeat that B times. The distribution of all those Bootstrap means is our Bootstrap sampling distribution. The standard deviation of all the distribution of the Bootstrap means is the Bootstrap standard error.
In discussing Bootstrap methodology, he contrasts large sample theory based on a single sample with the Bootstrap approach.
Why might you use the Bootstrap approach?
- You don’t have a large sample and cannot assume the sampling distribution is normal
- It may be difficult to determine the standard error of the estimate
You can view Mike Marin’s video here.
Next, let’s see how to implement the Bootstrap in Excel for the estimating a mean example.
You can view that video from the Data Analytics and Econometric Using R channel here.
Now, let’s look at a realistic example using Excel and Minitab 17.
Open a blank workbook in Excel.
In column 1, use Fill to fill a series from 1 to say 1000. 10000 if you follow the recommendation in the video from Mike Marin.
First, enter the number 1 into the first cell. Fill needs a number to start.
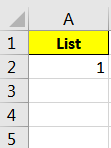
Go to Home > Fill
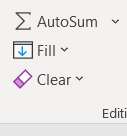
Click on Series.
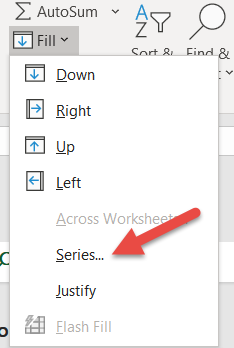
Choose Columns and enter the Stop value. We will use a 1000.
Click on OK. You now have numbers from 1 to 1000.
Put the data from which you will sample in column 2. We have entered 100 data points from an Exponential distribution with a generated mean of 50 using Minitab 17.
Select the rows for which you will sample from 1 to n. We will choose to take a random sample of 30.
Go to Calc>Random Data>Sample from Columns
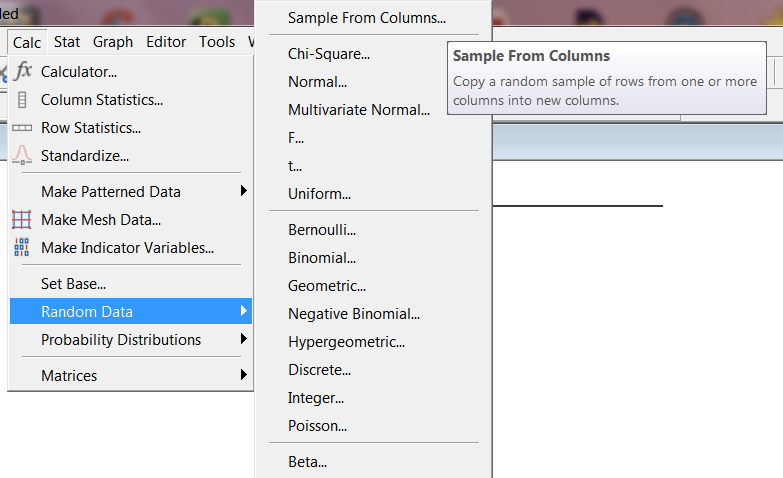
Fill out as shown. We are only getting one sample of unique numbers so do not check Sample with Replacement. Click on OK.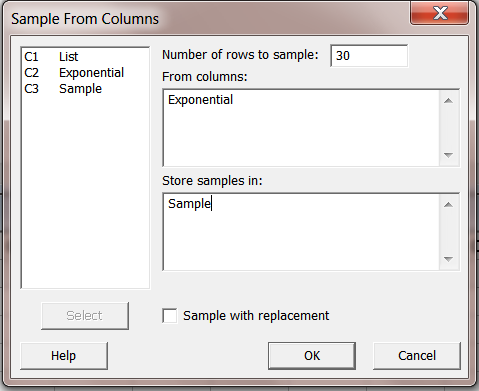
Copy and paste the random sample of 30 into your Excel spreadsheet.
Highlight the sample of 30.
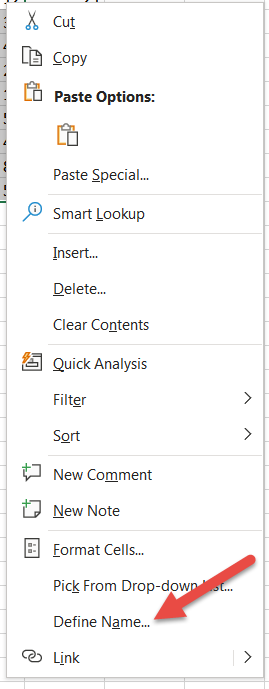
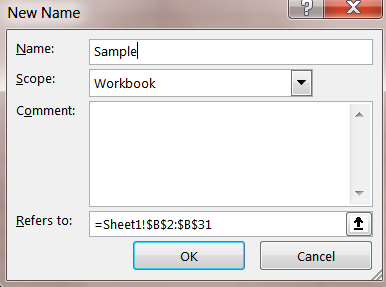
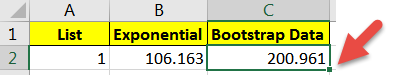
Right click on the highlighted data to get the following screen and name the sample Sample
Now type the command as seen in the previous Excel video below in column 4 , in the row corresponding to first row of sample data.
INDEX(sample, RANDBETWEEN(2,ROWS(sample)), 1)
Highlight first cell in column 4 as shown and click on the fill handle shown. Let us take our first Bootstrap sample of say size 10.
Drag across columns until you have filled 10 as shown.
![]()
This is your first Bootstrap Sample.
With the row highlighted, double click on the fill handle on the last column,
You now have 1000 Bootstrap samples of size 10.
NOTE: If you don’t subsequently remove the formula from the first data cell, which we didn’t, every time you click on the column or save the workbook and reopen it you will generate a different 1000 bootstrap dataset using our original Sample.
Now that we have the bootstrap data, let’s analyze it. We’ll use Minitab 17 but this all could have been done in Excel.
Copy the Bootstrap Data into Minitab. We will use this data from the first set for analysis.
NOTE: as mentioned every time you click on a cell in the Excel spreadsheet, a new set of 1000 samples of size 10 will be generated.
Let’s calculate the row statistics for the Bootstrap Average, Median, and Standard Deviation.
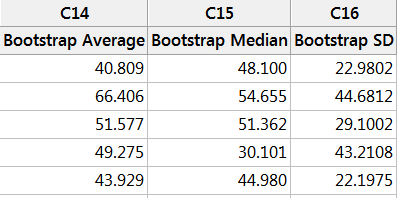
Go to Calc>Row Statistics and highlight the relevant columns as shown. Select them as Input variables and store the result in a column named Bootstrap Average.
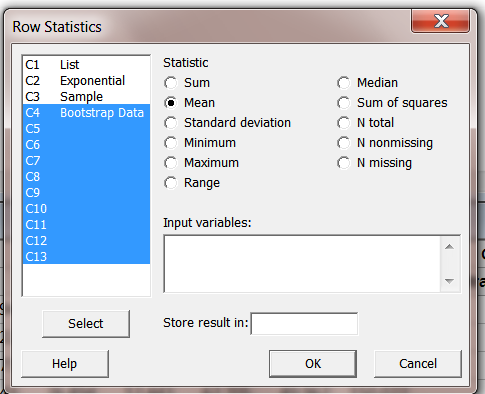
Repeat this for row statistic median and standard deviation.
Let us use the Bootstrap Average data to obtain a 95% confidence interval for the population mean.
First, let us look at a histogram of the Bootstrap Average data.
Go to Graphs>Histogram and construct a simple histogram.

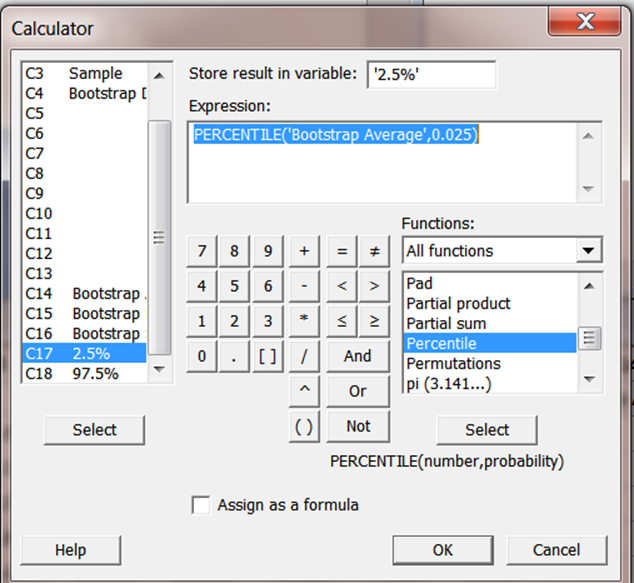
We will use the 2.5 percentile and the 97.5 percentile on the histogram data to find the middle 95% resulting in the desired confidence interval. We do this in case the resulting histogram data is not normally distributed. This is a more general approach. With 1000 data points, we have more than enough data to generate reliable percentile numbers.
Go to Calc>Calculator choose the Percentile function and fill out as shown. Click OK to generate the 2.5 percentile. Repeat for the 97.5 percentile.
We obtained the result shown. Yours will be different.
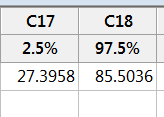
Thus, our Bootstrap constructed 95% confidence interval using our original random sample of 30 is 27.4 to 85.5.
The Bootstrap Average data is not normally distributed. It’s average is 52.119. The standard deviation of the Bootstrap Average data is 15.12. As mentioned in Professor Marin’s video this standard deviation is the standard error of the Bootstrap Average data. Had we ignored the non-normality of the data and calculated the 95% confidence interval on the mean using the above statistics, we would have had a 95% confidence interval of 52.119 + or – 1.96*15.12 or (22.48, 81.72).
Now let’s listen to Professor Bradley Efron, who invented the Bootstrap approach in 1979, briefly discuss the Bootstrap.
You can view the interview here.
Lastly, here are two more links to Professor Mike Marin’s videos on using Bootstrap for hypothesis testing and to construct a confidence interval on the difference between two means.
Bootstrap for Hypothesis Testing


Leave A Comment