In today’s blog, we look at Bayes Theorem, what it is and why it’s useful. After an explanation of Bayes Theorem, we’ll look at medical examples.
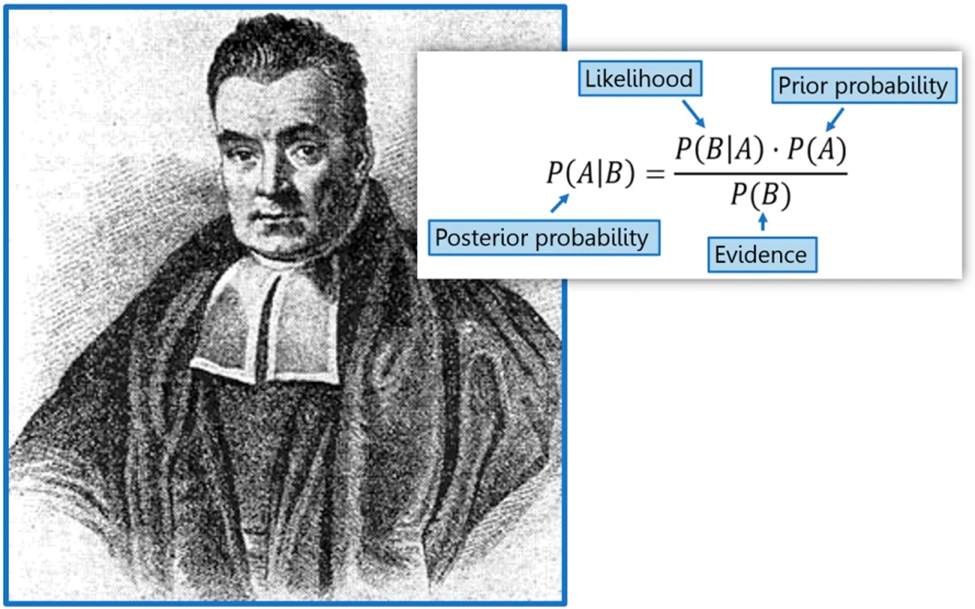
Thomas Bayes
Thomas Bayes was an English Presbyterian minister, philosopher, and a statistician (1701-1769). He is known for developing a specific example of the theorem that has become to be known as Bayes Theorem.
Bayes Theorem
Bayes Theorem gives a way to update “beliefs”, hypothesis A, based on new evidence. It allows us to calculate the probability of a hypothesis (P(A|B) based on its prior probability, P(A) , the probability of the observed data, P(B), and the probability of observing data given the hypothesis, P(B|A). The video mentioned below provides an excellent introduction and examples of Bayes Theorem.
We usually provide a video of a related subject at the end of the blog. But, having viewed several that discuss Bayes Theorem, we settled on the one that does a very good job of introducing it as the best explanation of the theorem. We urge you to watch it before continuing with the blog.
Bayes Theorem Video: Explanation and Examples
A video from The Organic Chemistry Tutor does an excellent job of explaining Bayes Theorem.
See the video titled “Bayes' Theorem of Probability With Tree Diagrams & Venn Diagrams” here.
Pay particular attention to the use of Bayes Theorem to calculate the probability of a man having prostate cancer given a positive medical screening exam which begins at 8:45.

We list the results reported in the video (shown in bold) below and include additional possible results:
- P(Prostate Cancer) = 0.12
- P(No Prostate Cancer) = 0.88
- P(Positive Test|Prostate Cancer) = 0.95
- P(Negative Test|Prostate Cancer) = 0.05
- P(Positive Test|No Prostate Cancer) = 0.06
- P(Negative Test|No Prostate Cancer) = 0.94
- P(Prostate Cancer|Positive Test) = 0.683
- P(No Prostate Cancer|Positive Test) = 0.317
- P(No Prostate Cancer|Negative Test) =
- P(Prostate Cancer|Negative Test) =
- P(Positive Test) = 0.1668
- P(Negative Test) = 0.8332
Having seen the video, it is instructive to see how such results are reported in epidemiological research and to relate them to the probabilities above.
The most common measures are:
- Sensitivity
- Specificity
- Positive Predictive Value
- Negative Predictive Value
You can find their definitions along with examples in the article below.
We show a key diagram from the article and will use it to develop the probabilities already discussed in the previous video

Another Venn Diagram helps in the understanding.
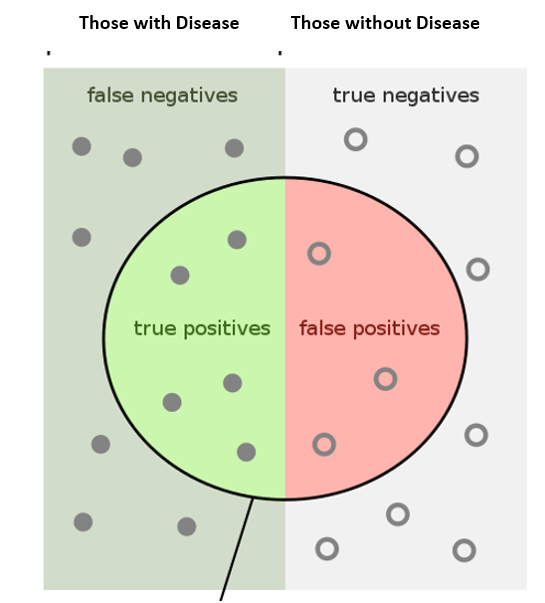
NOTE: Venn Diagram excerpted from the following link.
Sensitivity refers to a test's ability to designate an individual with disease as positive. That is P(Test Positive|Disease).
A highly sensitive test means that there are few false negative results, and thus fewer cases of disease are missed. That is P(Test Negative|Disease)
The specificity of a test is its ability to designate an individual who does not have a disease as negative. That is P(Test Negative|No Disease) So a false positive is (Test Positive|No Disease)
In other words, Sensitivity is the ability of a test to correctly identify patients with a disease.
Specificity is the ability of a test to correctly identify people without the disease
Positive predictive value:
It is the ratio of patients truly diagnosed as positive to all those who had positive test results
Negative predictive value:
It is the ratio of patients truly diagnosed as negative to all those who had negative test results
From the Epidemiology Stat 507 lesson, the following definitions are:
- Prevalence of Disease = (Tdisease/Total) * 100
- Sensitivity = P(Test Positive|Disease) = ((A/(A+C))*100
- Specificity = P((Test Negative|No Disease) = ((D/(D+B))*100
- Positive Predictive Value = ((A/(A+B))*100 = P(Disease|Test Positive)
- Negative Predictive Value = ((D/(D+C))*100 = P(No Disease|Test Negative)
Now let’s relate these to the example from the previous video.
We repeat the numbers from the prostate cancer example in the video to match the graphic above.
| Prostate Cancer (PC) | No Prostate Cancer (NPC) | Total | |
| Positive Test | A: True Positive 1140 | B: False Positive 528 | Tpositive test 1668 |
| Negative Test | C: False Negative 60 | D: True Negative 8272 | Tnegative test 8332 |
| Tpc 1200 | Tnpc 8800 | Total 10,000 |
We also repeat the decision tree from the video:
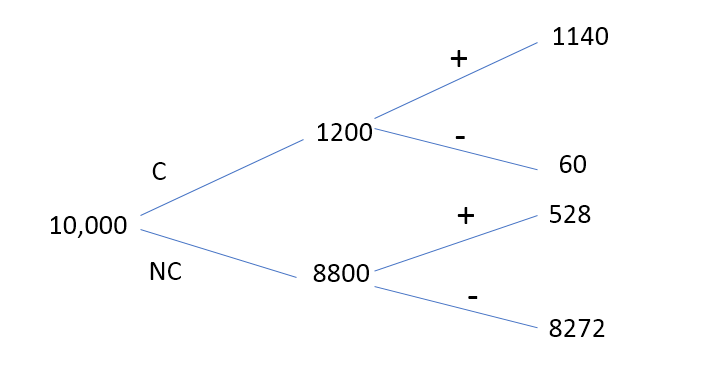
Using the data from the video and the definitions from the lesson we have:
- Prevalence of Prostate Cancer = (1200/10,000)*100 = 12%
- Sensitivity = ((1140/1200)*100 = 95% , P(Test Positive|Prostate Cancer) = 0.95
- False Negatives = 5%, P(Test Negative|Prostate Cancer) = 0.05
- Specificity = ((8272/8800)*100 = 94% = P(Negative Test|No Prostate Cancer)
- False Positives = 6% = (Positive Test|No Prostate Cancer)
- Positive Predictive Value = (1140/1668)*100 = 68.3% , P(Prostate Cancer|Test Positive) = 0.683
- P(No Prostate Cancer|Test Positive) =0.317
- Negative Predictive Value = (8272/8332)*100 = 99.3%, P(No Prostate Cancer|Test Negative) = 0.993
- P(Prostate Cancer|Test Negative) = 0.007
Here’s another similar example for those who want to check their understanding.
Cologuard is a non-invasive test for Colorectal Cancer (CRC) and Advanced Adenoma (Polyp > 1 cm) which uses presence of blood and DNA results.
We reproduce Table 31 from the following article “SUMMARY OF SAFETY AND EFFECTIVENESS DATA (SSED)”
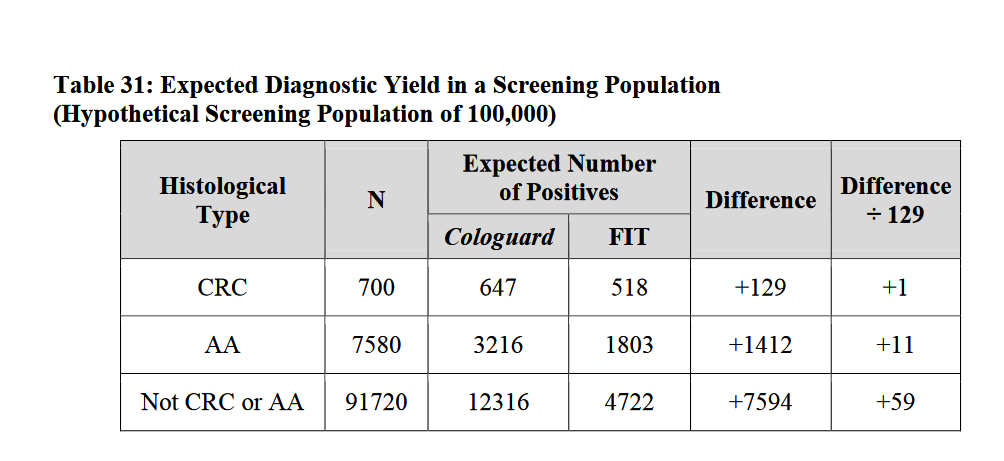
CRC = Colorectal Cancer
AA = Advanced Adenoma = polyp > 1 cm.
FIT is an older test. Let’s just focus on the Cologuard information. We construct a similar table to the prostate cancer example based on Table 31.
Here’s the information needed to construct the needed table.
Those with Disease (CRC+AA) = 7580 + 700 = 8280
Those without Diseases (No CRC+AA) = 100,000 – 8280 = 91,720
Positive Cologuard Test |Disease= 647 + 3216 = 3863
Positive Cologuard Test | No Disease = 12,316
| (CRC+AA) | (No CRC +AA)) | Total | |
| Positive Cologuard Test | A: True Positive 3863 | B: False Positive 12,316 | Tpositive test 16,179 |
| Negative Cologuard Test | C: False Negative 4417 | D: True Negative 79,404 | Tnegative test 83,821 |
| T(CRC+AA) 8280 | T(No CRC+AA) 91,720 | Total 100,000 |
Given the above table, a patient wants to know what the probability of having the disease if there is a positive test. In other words, what is the positive predictive value?
What do you get for the other definitions mentioned earlier?


Leave A Comment