Data transformations are useful and necessary in some statistical applications. We will discuss one of the most famous ones, the Box-Cox transformation.

We will use two of the most often used software programs for Six Sigma analysis: SigmaXL and Minitab to implement the Box-Cox Transformation.
First, let’s briefly remind you of why a transformation is sometimes required for statistical analysis. If the procedure assumes normality, you may need a transformation. Also transformations can stabilize the variance in a procedure that requires constant variance. It can be used to linearize relationships.
The basic assumption of the Box-Cox transformation is that data must be positive and continuous.
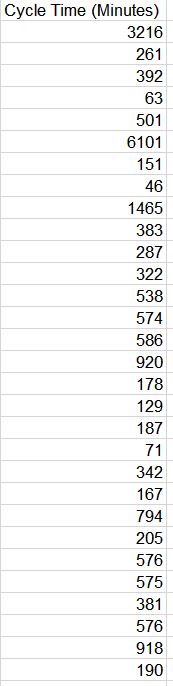
In the first video from SigmaXL, we see how the Box Cox transformation is applied so that the normality assumption required for an individuals control chart is satisfied. The data set Normal Cycle Time2 can be found in the sample data supplied with SigmaXL.
You can view the video here.
Suppose you wanted to use the Box Cox transformation on the above data to find the best transformation. That happened behind the scenes in the application shown.
Once you’ve fired up SigmaXL, in this case Version 9, and loaded the data set, go to Data Manipulation to see the following:
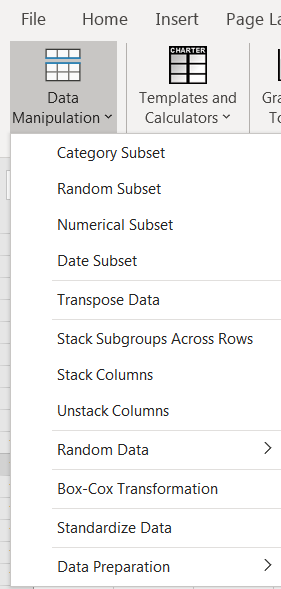
Choose Box-Cox Transformation. Select your data and click Next.
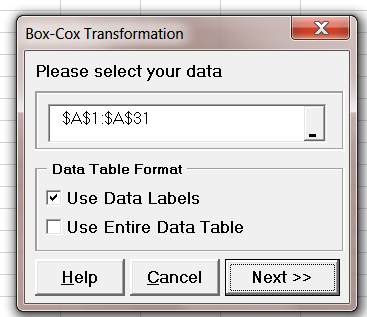

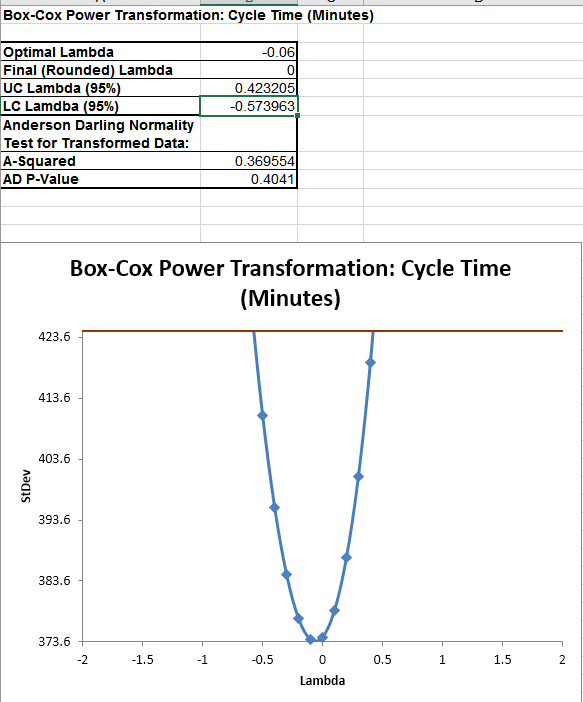
Select your variable, use Rounded Lambda, and click OK.
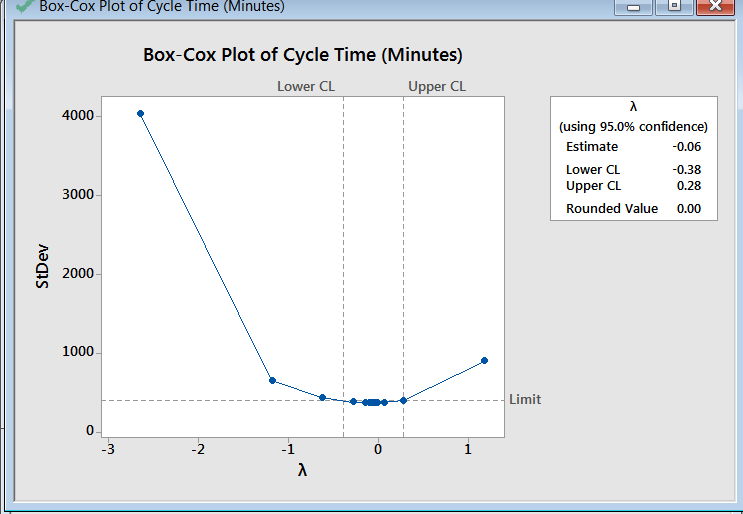
We obtain the result which shows the best rounded Lambda is 0, corresponding to the Ln transform.
Now let’s repeat the exercise using Minitab 17 and the same data set.
Once the data is loaded, go to Stat>Control Charts>Box-Cox Transformation.


Choose your variable and use a subgroup size of 1. Click on Options use an Optimal or rounded Lambda. Store the transformed data in column 2 and click OK and OK.
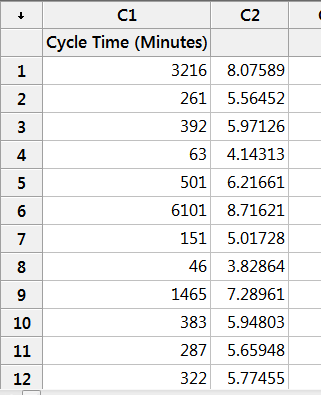
Again, as expected, we see that the rounded Lambda result is 0.0 indicating a Ln transform.
We show a partial view of the resulting table.
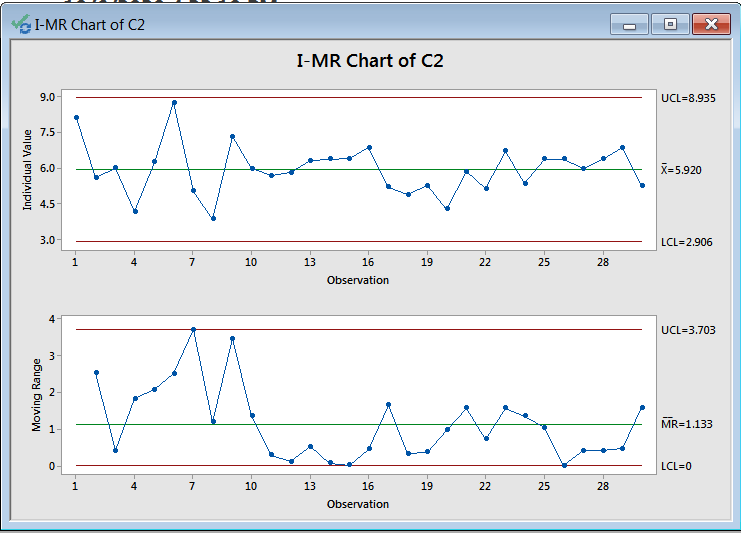
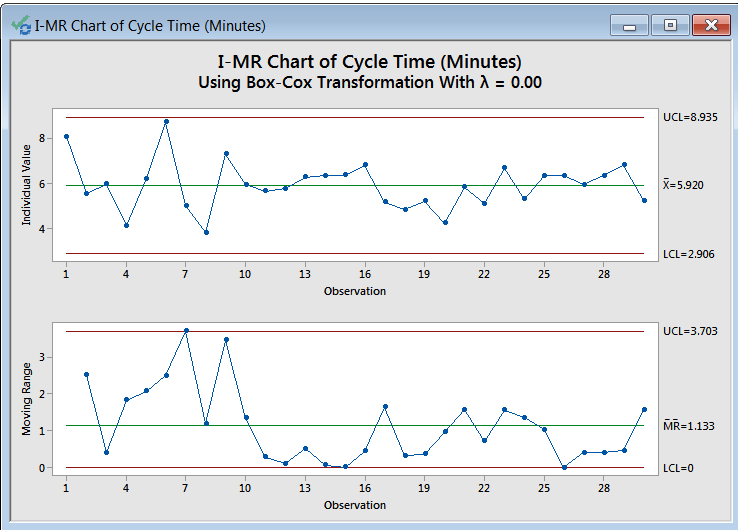
Now that we have the data transformed, we can construct the individuals and moving range charts as was done in SigmaXL.
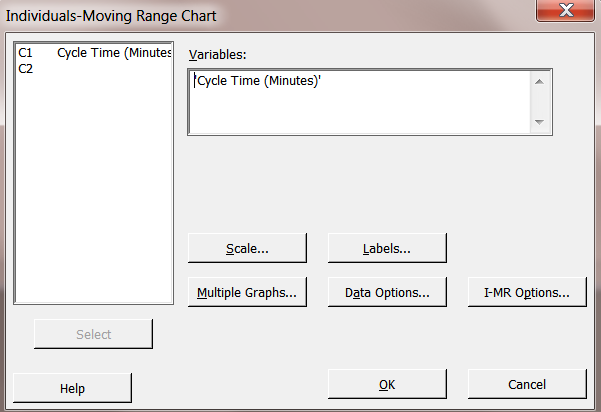
Click on Stat>Control Charts>Variable Charts for Individuals and choose I-MR.


Note, we will go directly to the resulting charts without going to I-MR Options to turn on all the tests in order to just show the resulting graphs.
Note: As in the SigmaXL video, we could have gone directly to Control Charts>I-MR on the raw data and automatically applied the Box-Cox. We show that sequence below.
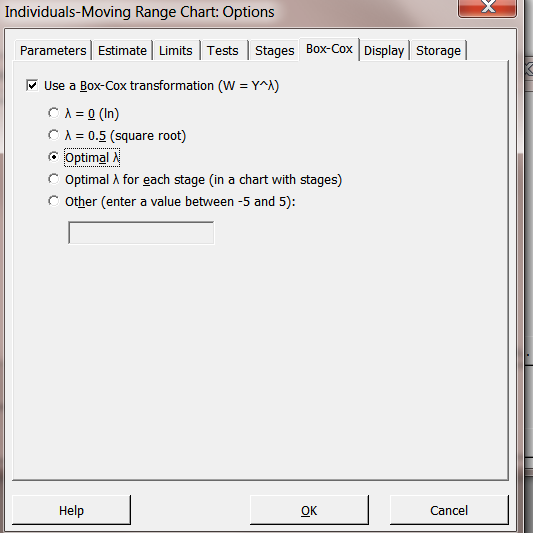
Go to I-MR Options. Choose Box-Cox.
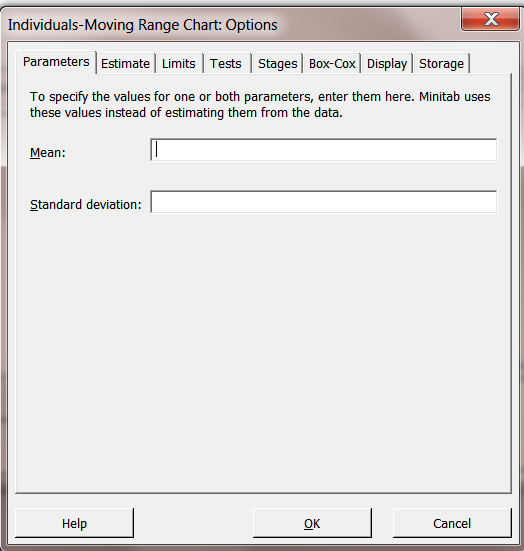
Choose Use a Box-Cox transformation, select Optimal Lambda, and Click OK, and OK.
We obtain the same I-MR chart pair as before.
If you are interested in the formulas for the Box-Cox transformation and the reason for their form, please consult this short video by Michael Bierlaire from the Introduction to Choice Models course from the École polytechnique fédérale de Lausanne.


Leave A Comment