
The Reverse Fishbone Diagram
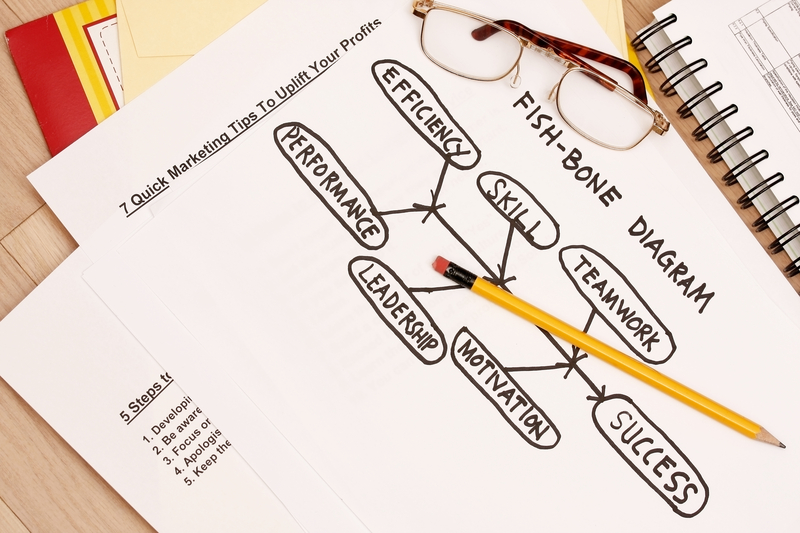
We’re very familiar with the Fishbone Diagram (Cause and Effect Diagram), also known as the Ishikawa Diagram, whereby we analyze the potential causes of a given effect. We will look at the Reverse Fishbone Diagram which is used to analyze the impacts of a change. Other names for the Reverse Fishbone Diagram include: Backward Fishbone [...]
