
The National Institute of Standards and Technology (NIST) has spent decades developing and maintaining the most comprehensive, free guide for statistical analysis available.
While the intended audience is listed as scientists and engineers, the handbook will be of use to anyone having to conduct statistical analysis.
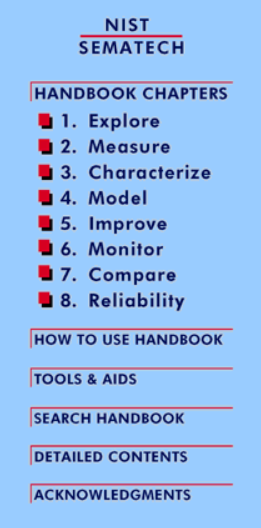
As you can see, the handbook chapters lay out the methodologies needed for data analysis, process improvement, and product reliability.
Each chapter was written by experts in that field and focuses on why and how to conduct the analyses.
Pay particular attention to other listed information:
- How to Use Handbook
- Free statistical software is used for analysis in the Handbook: Both R and DataPlot which is provided at no charge by NIST
- Tools & Aids
- Common Engineering Questions, some with Flowcharts
- Galleries
- Graphical Techniques
- Quantitative Techniques
- Case Studies
- Probability Distributions
- Statistical Software
- Data Sets
- Printer-Friendly eHandbook files
- Search Handbook
- Excellent search feature for finding information within the Handbook
The Common Engineering Questions and Galleries are particularly useful.
The Common Engineering Questions with flowcharts allow you to click on a particular flowchart box to get the detailed instructions for carrying out the shown operation.
The Galleries allow you to click on the graphic or the listed category to get detailed information.
As an example of quite useful material that you may not find elsewhere, let’s look at the first chapter, Explore.
This focuses on Exploratory Data Analysis (EDA), an area of analysis first developed by John Tukey, one of America’s most famous mathematicians.
EDA, in the NIST handbook, was written by James Filiben, one of Tukey’s PhD students and a long-time prominent statistician at NIST.
You know to summarize your data, but what does EDA provide that a simple summary doesn’t? We quote from the handbook.
How Does Exploratory Data Analysis Differ from Summary Analysis?
Summary
A summary analysis is simply a numeric reduction of a historical data set. It is quite passive. Its focus is in the past. Quite commonly, its purpose is to simply arrive at a few key statistics (for example, mean and standard deviation) which may then either replace the data set or be added to the data set in the form of a summary table.
Exploratory
In contrast, EDA has as its broadest goal the desire to gain insight into the engineering/scientific process behind the data. Whereas summary statistics are passive and historical, EDA is active and futuristic. In an attempt to "understand" the process and improve it in the future, EDA uses the data as a "window" to peer into the heart of the process that generated the data. There is an archival role in the research and manufacturing world for summary statistics, but there is an enormously larger role for the EDA approach.
You can access the handbook here!


Leave A Comment