
Simpson's paradox occurs when a trend appears in several different groups of data but disappears or reverses when the data from these groups are combined.
In this video, Guillaume Riesen, currently a Ph.D. student in neuroscience at Stanford University, gives examples of how combining data from two disparate groups can lead to a different and misleading conclusion due to a third, lurking variable.
As Guillaume points out, before making conclusions from any data, you must be aware of any lurking variables between the groups you are comparing and “have a firm grasp about causal relationships among the variables in play.”
Graphing your data appropriately can go a long way in helping.
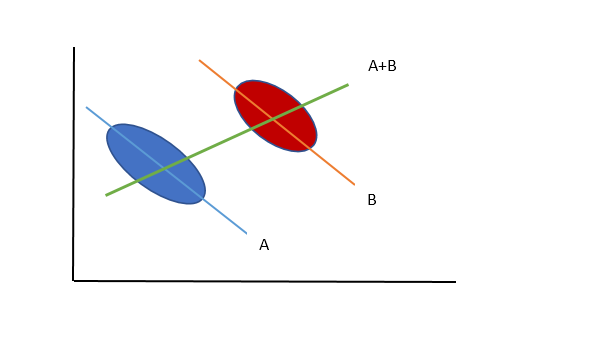
In this example diagram, the A data has a downward trend as does the B data. However, when combined, the A+B data has an upward trend.
As Guillaume mentions, there are several real examples found in Wikipedia.
- UC Berkeley Gender Bias
- Kidney Stone Treatment
- MLB Batting Averages
There in the section labeled Implications for Decision Making, the point is aptly made that depending on the “story” behind the data, sometimes the aggregated data dictates the correct decision.
“As to why and how a story, not data, should dictate choices, the answer is that it is the story which encodes the causal relationships among the variables.”
You can see Guillaume’s instructive video here.


Leave A Comment